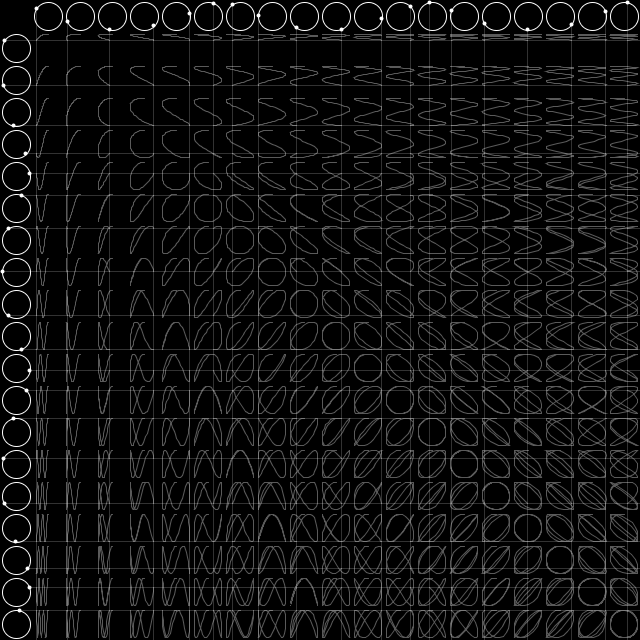
Curve.pde
class Curve {
	ArrayList<PVector> path;
	PVector current;

	Curve() {
		path = new ArrayList<PVector>();
		current = new PVector();
	}

	void setX(float x_) {
		current.x = x_;
	}

	void setY(float y_) {
		current.y = y_;
	}

	void addPoint(float x, float y) {
		path.add(new PVector(x, y));
	}

	void addPoint() {
		path.add(current);
		current = new PVector();
	}

	void show() {
		stroke(255, 90);
		strokeWeight(1);
		noFill();
		beginShape();

		for(PVector v : path) {
			vertex(v.x, v.y);
		}

		endShape();
	}

	void reset() {
		path = new ArrayList<PVector>();
	}
}
lissajous_table.pde
float angle = 0;
int w = 32;
int h = w;
int cols = 0;
int rows = 0;

Curve[][] curves;

void setup() {
	//fullScreen(P3D);
	size(640, 640);
	cols = ((width / w) - 1);
	rows = ((height / h) - 1);

	curves = new Curve[ rows ][ cols ];

	for(int y = 0; y < rows; y++) {
		for(int x = 0; x < cols; x++) {
			curves[ y ][ x ] = new Curve();
		}
	}
}

void draw() {
	background(0);

	float d = w - 4;
	float r = (d / 2);

	int dot_size = 4;

	noFill();

	for(int i = 0; i < cols; i++) {
		float cx = (w + i * w + w / 2);
		float cy = (w / 2);

		stroke(255);
		strokeWeight(1);
		ellipse(cx, cy, d, d);

		float x = (r * cos(angle * (i + 1) - HALF_PI));
		float y = (r * sin(angle * (i + 1) - HALF_PI));

		strokeWeight(dot_size);
		point(cx + x, cy + y);

		stroke(255, 50);
		strokeWeight(1);

		line((cx + x), (cy + y), (cx + x), height);

		for(int j = 0; j < rows; j++) {
			curves[ j ][ i ].setX((cx + x));
		}
	}

	for(int i = 0; i < rows; i++) {
		float cx = (h / 2);
		float cy = (h + i * h + h / 2);

		stroke(255);
		strokeWeight(1);
		ellipse(cx, cy, d, d);

		float x = (r * cos(angle * (i + 1) - HALF_PI));
		float y = (r * sin(angle * (i + 1) - HALF_PI));

		strokeWeight(dot_size);
		point(cx + x, cy + y);

		stroke(255, 50);
		strokeWeight(1);

		line((cx + x), (cy + y), width, (cy + y));

		for(int j = 0; j < cols; j++) {
			curves[ i ][ j ].setY((cy + y));
		}
	}

	for(int y = 0; y < rows; y++) {
		for(int x = 0; x < cols; x++) {
			curves[ y ][ x ].addPoint();
			curves[ y ][ x ].show();
		}
	}

	angle -= 0.02;

	if(angle < -TWO_PI) {
		for(int y = 0; y < rows; y++) {
			for(int x = 0; x < cols; x++) {
				curves[ y ][ x ].reset();
			}
		}

		angle = 0;
	}

	if(frameCount == 50) { save("preview.png"); }
}